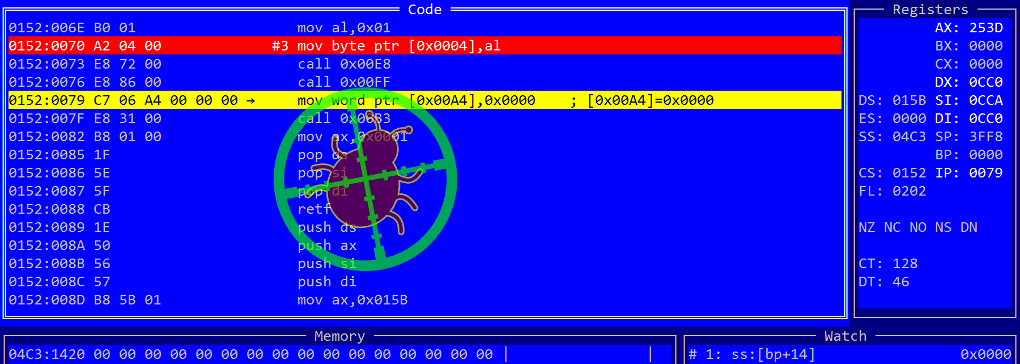
Win3mu - Part 11 - 8086 Debugger
It’s not every day you get to write a debugger!
I just spent the last week or so working on the debugger for Win3mu (my Windows 3 emulator — see here) and thought it might be interesting to write up how it works.
A Quick CPU Refresher
The debugger I’ll be describing is a companion to, and works closely with the Sharp86 CPU emulator used in Win3mu. I’ve written about the CPU before (see here) but here’s a quick refresher…
The CPU is implemented in a single class named (incredibly) “CPU”. It has a set of public properties for the registers and communicates with the outside world via an IMemoryBus interface.
class CPU
{
    // Registers
    public ushort ax;
    public ushort bx;
    // etc...

    // Busses
    public IMemoryBus MemoryBus { get; set; }
    public IPortBus PortBus { get; set; }

    // Run
    public void Step();

    // Debugger
    public IDebugger Debugger { get; set; }
}
Previously there was single bus named IBus which has now been separated into two: one for the I/O ports (IPortBus) and one for the memory (IMemoryBus) — they’re functionally equivalent to before.
The CPU can be made to run by repeatedly calling its Step() method:
void RunCode()
{
    _cpu = new CPU();
    _cpu.MemoryBus = new GlobalHeap();

    while (!_theEndOfTime)
    {
        _cpu.Step();
    }
}
Design Goals
Before describing how the debugger works I should mention a couple of design goals I was aiming for:
- Minimal Performance Impact — I’m not too concerned about performance for this project but even so, I didn’t want the CPU performance to be dramatically affected when not debugging.
- Cross Platform — Win3mu is definitely not cross platform but the Sharp86 CPU emulation is. The core functionality of the debugger should be too (but not necessarily its UI).
- Not a Special Build — unlike some other emulators I didn’t want the debugger to be part of a “special build”. Rather it should be possible to attach the debugger at run-time.
- Separate Packaging — it should be possible to distribute Sharp86 without the debugger.
Basic Design
The basic design for the debugger starts with a single, almost trivial interface named IDebugger:
public interface IDebugger
{
    bool OnStep();
    bool OnSoftwareInterrupt(byte interruptNumber);
}
The CPU calls this interface at two key points:
- Whenever it’s about to execute an instruction
- Whenever a software interrupt is raised
From the CPU’s perspective that’s it! Everything else related to the debugger is invisible and is implemented in a separate assembly.
DebuggerCore provides a standard implementation of the main debugger features including managing and detecting break points, watch expressions, serialization but needs a derived class to provide the UI.
It doesn’t provide a user interface because of the cross-platform requirement.
It would be quite easy to build a cross-platform gdb-style command mode debugger but my previous emulator had this and while it worked, it was tedious to use. For this project wanted something a little better and I’ll explain later how I used the Windows Console API to build a GUI-ish text mode UI.
Disassembler
One of the most basic requirements of a debugger is viewing the code that’s running. Since there’s practically no source code for anything that Win3mu runs that essentially means disassembled machine code.
Sharp86's disassembler started out as a copy of the CPU class which was then modified by replacing every instruction handler with code to render a disassembly string rather than execute an instruction.
public class Disassembler
{
    // Machine code read from here
    public IMemoryBus MemoryBus { get; set; }

    // Using this address
    public ushort cs { get; set; }
    public ushort ip { get; set; }

    // Read disassembled instruction here
    // (which also update cs:ip to next instruction)
    public string Read()

    // True if last disassembled instruction was a call
    public bool IsCall;
}
The API very is similar to the CPU
- It reads code bytes from an
IMemoryBus - It has its own
CS:IPregisters that it updates as it disassembles - A
Readmethod that disassembles one instruction and moves to the next
The Break Method
The simplest way to stop a program in the debugger is for the host program (ie: the emulator) to call its Break method.
When Break is called, DebuggerCore sets an internal flag that will cause the debugger to stop the next time the CPU’s Step method is called. (ie: not immediately).
// Force break in the debugger on the next instruction
public void Break()
{
    _break = true;
}
The Break method can be used in a few different ways:
- Before starting a program so that execution stops at the very start. Win3mu has a command line switch (
/break) for this. - When an unusual condition happens in the program. eg: an exception, or perhaps when the program calls a special function to break into the debugger.
- In response to a user initiated action. Win3mu currently has the F9 key wired to this so that the running program can be manually stopped and inspected.
Break Points
The debugger supports a few different kinds of break points but they all derive from a common base class “BreakPoint”.
Besides a set of administrative methods and properties (eg: break point number, enabled flag, serialization etc…) the BreakPoint class has one method of significance “ShouldBreak”.
public abstract class BreakPoint
{
    // Check if this break point wants the debugger to stop
    public abstract bool ShouldBreak(DebuggerCore debugger);

    [Json("number")]
    public int Number { get; set; }

    [Json("enabled")]
    public bool Enabled { get; set; }
}
The simplest kind of break point is a CodeBreakPoint which stops when execution hits a particular memory address:
public class CodeBreakPoint : BreakPoint
{
    public CodeBreakPoint(ushort segment, ushort offset)
    {
        Segment = segment;
        Offset = offset;
    }

    public ushort Segment;
    public ushort Offset;

    public override bool ShouldBreak(DebuggerCore debugger)
    {
        var cpu = debugger.CPU;
        return cpu.cs == Segment && cpu.ip == Offset;
    }
}
DebuggerCore manages a list of break points and one temporary break point (which will be explained below). When IDebugger.OnStep is called the first thing it does is check if any break points should trigger a break. If so, the same break flag used for manual breaks is set.
Finally the break flag is checked and if set the OnBreak method is called. If not set the temporary break point is discarded and OnStep returns allowing the CPU to execute the next instruction.
void IDebugger.OnStep()
{
    // Test all break points
    for (int i=0; i<_allBreakPoints.Count; i++)
    {
        if (bp.Enabled && bp.ShouldBreak(this))
        {
            _break = true;
        }
    }

    // Test the temporary break point
    if (_tempBreakPoint!=null && _tempBreakPoint.ShouldBreak(this))
    {
        _break = true;
    }

    // Break now?
    if (_break)
    {
        // Clear the break flag
        _break = false;

        // Clear the temp break point
        _tempBreakPoint = null;

        // Call debugger UI
        OnBreak();
    }
}
Implementing OnBreak
The OnBreak method is where the debugger’s user-interface takes place. It’s implemented by a class derived from DebuggerCore and should not return until the debugger is ready for execution to continue.
Typically the OnBreak method will display a console window, accept user-input, display code, memory dumps, registers etc… as well as let the user set additional break points and otherwise interact with the debugger.
In the case of Win3mu the OnBreak method is implemented as a text mode GUI but as mentioned before it could also be implemented as a command mode console window. I’ll cover the UI in a later post.
Stepping Modes
Now that the debugger can stop on a break point the user may want to step through code. Three kinds of step operation are supported
- Single Step — execute one instruction
- Step Over — execute to the next line, skipping over call instructions
- Step Out — execute until the currently called function returns
Single Step is implemented by simply setting the break flag and resuming execution (ie: returning from OnBreak). The debugger will automatically break on the next call to OnStep.
Step Over uses the disassembler to figure out if the current instruction is a call instruction. If so then a temporary code break point is set on the address of the next instruction which can be found by reading the current instruction pointer from the disassembler.
If the current instruction is not a call then stepping is exactly the same as single stepping and the break flag is used.
// Single Step
void SingleStep()
{
    _break = true;
}

// Step Over
public void StepOver()
{
    // Check if the current instruction is a call instruction
    var instruction = _disassembler.Read(_cpu.cs, _cpu.ip);
    if (_disassembler.IsCall)
    {
        // Disassembler IP points to next instruction
        _tempBreakPoint = new CodeBreakPoint(_disassembler.cs, _disassembler.ip);
    }
    else
    {
        SingleStep();
    }
}
Step Out is a trickier. The condition to stop here is executing a return instruction when the stack pointer is higher than the stack pointer at the time the step over command was issued.
To detect this condition a new break point type is used — a StepOutBreakPoint and it’s set as the temporary break point before resuming execution.
public class StepOutBreakPoint : BreakPoint
{
    public StepOutBreakPoint(CPU cpu)
    {
        // Store the current stack pointer
        _ssBreakOnReturn = cpu.ss;
        _spBreakOnReturn = cpu.sp;
    }

    ushort _ssBreakOnReturn = 0;
    ushort _spBreakOnReturn = 0;

    // Break after executing a return instruction when the stack
    // pointer is higher than it currently is.
    public override bool ShouldBreak(DebuggerCore debugger)
    {
        var cpu = debugger.CPU;
        return cpu.DidReturn && cpu.ss == _ssBreakOnReturn && cpu.sp > _spBreakOnReturn;
    }
}
When constructed, it captures the current stack pointer and ShouldBreak checks if it just executed a return instruction and if the stack pointer is higher than the point at which the step out command was invoked.
Debug Messages
DebuggerCore includes a simple framework for writing messages to the debugger’s log window. Its Write and WriteLine methods both call the abstract WriteConsole method which the derived user interface class should implement and display somewhere.
There’s also a simple redirection mechanism so the output of executed commands can be redirected to a file or the clipboard. eg: Win3mu’s debuggers supports commands like this:
>dump global heap >> somefile.txt
>dump global heap >> clipboard
>dump global heap >> editor
Ramping Up
That’s the basics of how the debugger works — you can see there’s nothing too mystical about it and in fact it’s fairly straight forward.
There’s still a lot that hasn’t been covered though: the user-interface, expression engine, watch expressions, highlighting changed memory, disassembly annotations, command dispatcher, extensibility and more… most of which is covered in Part 2.
Overkill?
The original version of the debugger was very basic but worked reasonably well. I was planning to add features as required but here’s what I noticed…
While debugging through complex machine code its not easy to simply cancel out and add a new feature to the debugger as needed. Not only does one’s train of thought get broken, sometimes it’s really hard to get back to the place in the code where you were.
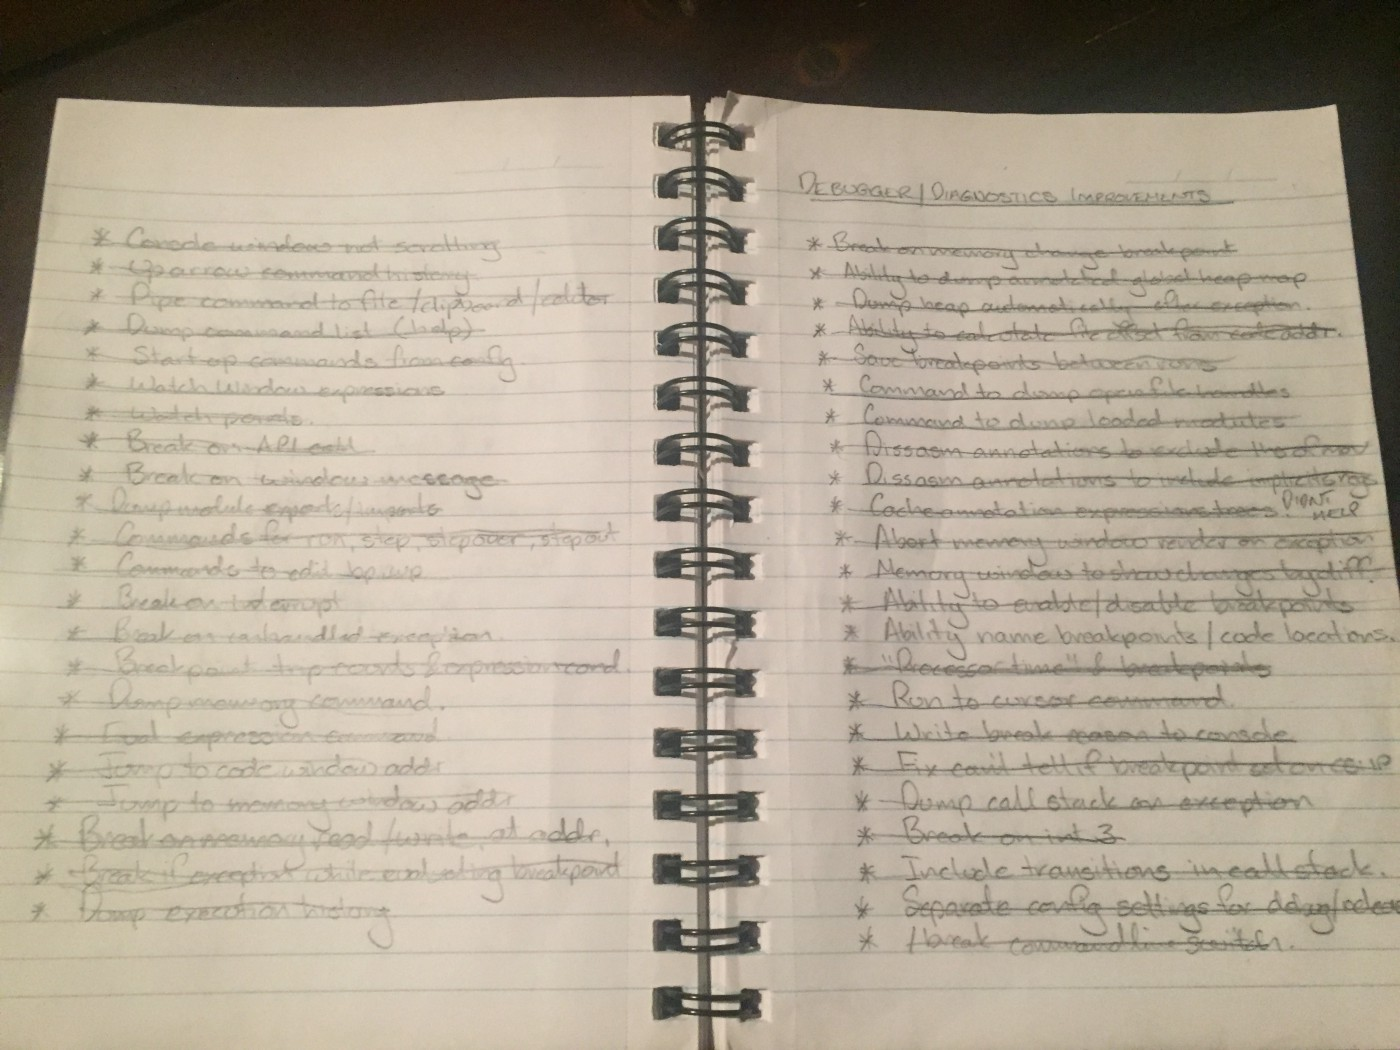
That’s why last week I set aside a nasty bug I was trying to track down, made a long list of debugger features that I thought would be useful and implemented every last one (well, every last one except one :).
Did it pay off? I think so. This morning I figured out that particular bug and although I only used perhaps half of the new debugger features I was glad for them in the heat of things.