Win3mu - Part 12 - Debugger (Continued)
This is part 2 of writing a debugger for Win3mu — a Windows 3 Emulator. If you’ve not done so already you might like to read part 1 and for more background there’s this series of articles about the emulator itself.
User Interface
The user interface for Win3mu’s debugger is a text mode GUI built on top of the Windows Console API. It uses a simple library called ConFrames to manage an arrangement of non-overlapping framed windows.
The UI supports keyboard navigation only (no mouse support atm) and operates on a simple event driven model. Key strokes are sent to the active frame window, windows paint themselves in a virtual paint function and invalidate themselves when something changes.
There’s really not too much more to it and rather than explain in any more detail I’ve made the source code for ConFrames available here, including a simple example program.
The Code Window
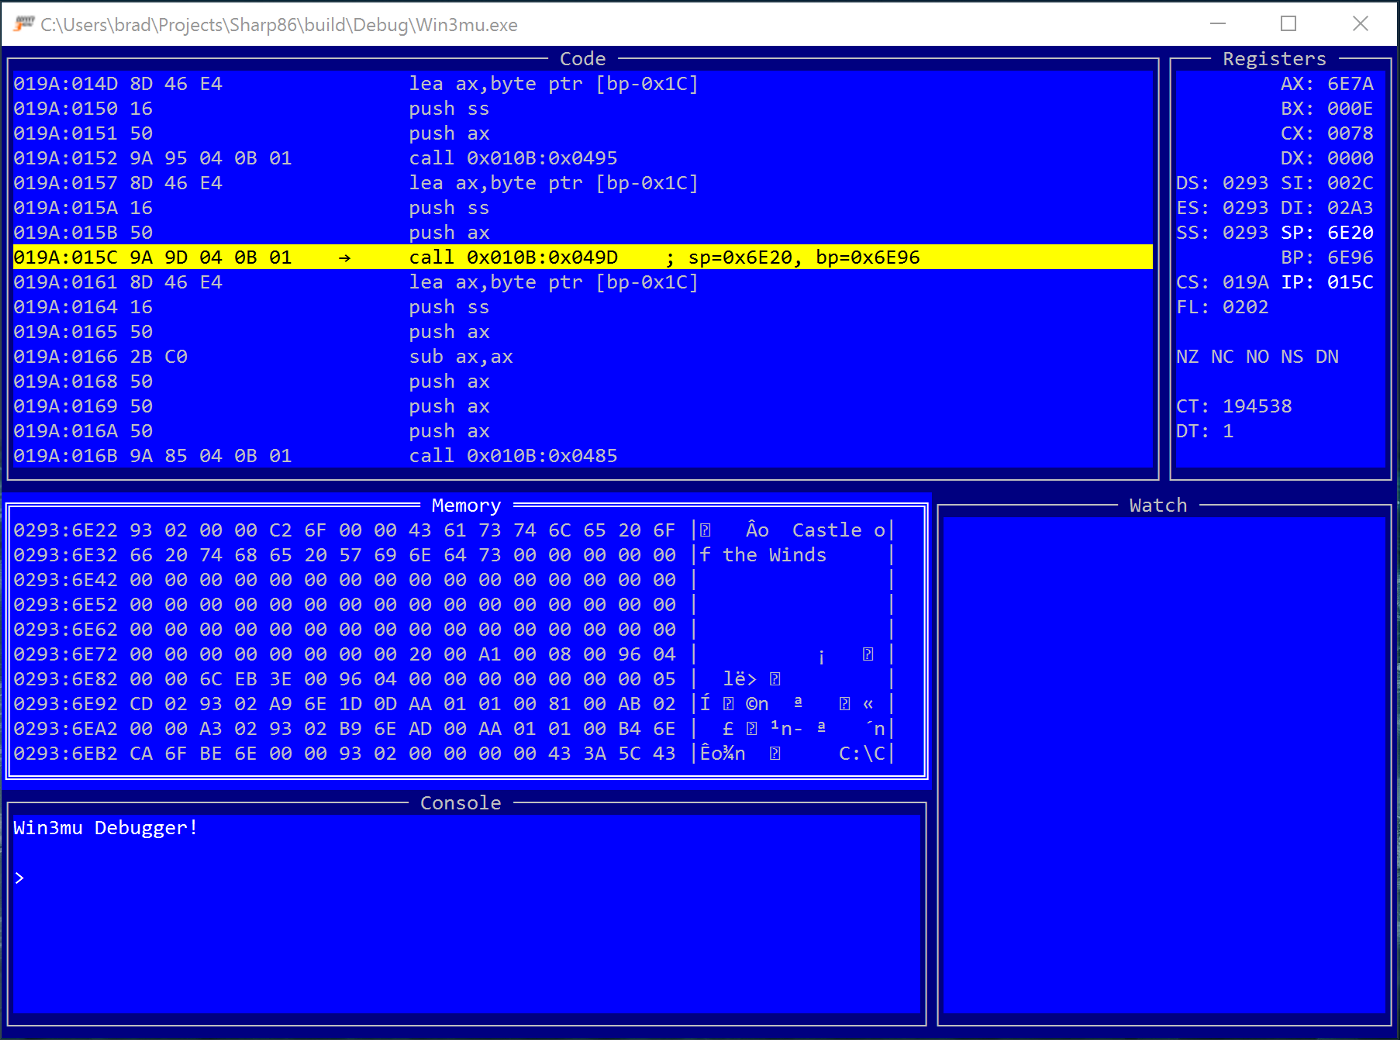
The code window displays the current execution point and a disassembled view of the surrounding instructions using the previously described disassembler class.
The trickiest part of the code window is figuring out how to scroll backwards. Since 8086 instructions have variable length how does one find the start of the previous instruction (or previous N instructions)?
The approach used is to go back further than necessary and disassemble forwards in the hope of landing back on the current instruction. If the current instruction is skipped over then adjust the starting position by one byte and try again.
I found that disassembling valid 8086 code tends to very quickly fall back into step with the correct instructions and haven’t had any problems with this approach.
Otherwise, implementing the code window was fairly straightforward. It highlights the current instruction and any instructions with break points and lets you type into the address column to move to a particular code location.
The Registers Window
The registers windows displays the current value of the CPU registers and highlights values that have changed since the last time the debugger was stopped.
There’s nothing complicated about the registers window although I did go through several variations of layout until I settled on the one shown — segment registers on the left and general purpose registers on the right.
The Memory Window
The memory window displays the contents of an area of memory. It can switch between a few different display modes (bytes, words, dwords etc…) and highlights values that have changed.
To detect changed values, the IMemoryBus interface used by the CPU was extended and the burden of detecting memory changes placed onto the global heap. If the memory bus doesn’t support this interface changed memory addresses aren’t highlighted.
[Flags]
public enum MemoryState : byte
{
    Invalid = 0,
    Valid = 0x01,
    Changed = 0x02,

    InvalidUnchanged = 0,
    InvalidChanged = Changed,
    ValidUnchanged = Valid,
    ValidChanged = Valid | Changed,
}

public interface IMemoryBusDebug
{
    void StartTracking();
    void EndTracking();
    void ResetState();
    void GetMemoryState(ushort seg, ushort startOffset, MemoryState[] state);
    bool DidMemoryChange(ushort seg, ushort offset, uint length);
}
The StartTracking/EndTracking methods are used to inform the heap whether memory change detection is required. The debugger calls these when it is attached/detached from the CPU.
The ResetState() method tells the heap to discard currently recorded changes and start recording new changes. The GetMemoryState() function populates an array of MemoryState values indicating which bytes have changed since the last call to ResetState.
The global heap implements change detection by taking a copy of the byte array backing a selector the first time its written to after a call to ResetState. It’s then a simple matter of comparing the old byte array and the new byte array to determine what has changed.
Originally memory change detection was implemented by replacing the CPU’s IMemoryBus interface with one that records which addresses were written to. There are two problems with this approach:
- It doesn’t capture changes to memory not originating from the CPU. eg: the emulator often updates memory directly which wasn’t detected by this approach.
- If two selectors are backed by the same memory then writing to one selector won’t show changes in the other.
The memory window currently doesn’t support editing memory but this would reasonably easy to add. Like the code window, navigation is with the arrow keys or by typing over the address fields at the left.
Debugger Expressions
The debugger includes an expression engine that can evaluate expressions with a syntax very similar to standard 8086 assembly language. I’ve written a separate article about expression engines. The concepts used in the debugger’s expression engine are essentially the same but with few noteworthy differences:
- It supports a range of types including bytes, words, dwords, doubles, strings etc…
- A full set of operators
- A square bracket “de-reference” operator for reading memory addresses eg:
word ptr es:[di+10] - A far pointer operator. eg:
0x1234:0x5678ords:bp+0x1234 - Special handling for default selectors depending on the used base register eg:
[bp]will use thessregister whereas[di]will use thedsregister. - A symbol scoping mechanism that lets expressions in different contexts have access to different sets of symbols.
The expression engine is used in a variety of places as described below…
The Watch Window
The watch window displays the current value of a set of user entered expressions. It is completely driven by the command dispatcher.
Each time the debugger breaks the watch window evaluates each watch expression and displays the resulting value.
The Command Window
The command window supports a typical command style user-interface. It can be used to enter commands to the debugger and displays the resulting output of those commands.
The command window doesn’t directly handle these commands. Instead it sends them to the command dispatcher which is part of the debugger core. The idea here is that a purely command driven debugger could use the same command dispatch mechanism.
Output to the command window is via the DebuggerCore Write methods which are directed to a virtual method that the command window intercepts to display in the text mode GUI.
Command Dispatcher
The command dispatcher uses reflection to inspect a set of “command handler” objects for methods to call in response to matching commands.
Consider the following method:
[DebuggerHelp("Remove a watch expression")]
public void w_del(DebuggerCore debugger, int number)
This method could be invoked through the command dispatcher with a command like this:
w del 7Some notes about the way this works:
- The
DebuggerHelpattribute is used to dynamically generate the output of a built in “help” command - Underscores in method names are used to create “sub-commands”. eg: “
w del”, “w list” etc…
The command’s parameters are parsed from the entered command line, or some types are just implicitly known. eg: any DebuggerCore parameter is passed a reference to the debugger.
One interesting thing about the command dispatcher is that any parameter can be entered as an expression. For example in the command bp cs:ip the “cs:ip” would be evaluated to the current instruction pointer and passed to the bp method.
However a command handler can also accept an expression — in which case the expression is parsed from the entered command but instead of evaluating it and passing the resulting value, the root node of the expression is passed.
Consider these two command handlers:
[DebuggerHelp("Add a code break point")]
void bp(DebuggerCore debugger, uint addr);

[DebuggerHelp("Add an expression watch")]
void w(DebuggerCore debugger, Expression.Node expr);
The bp command would be passed an already evaluated value while the w command would be passed an expression tree that can be stored and re-evaluated for display each time the debugger stops:
Assembly Annotations
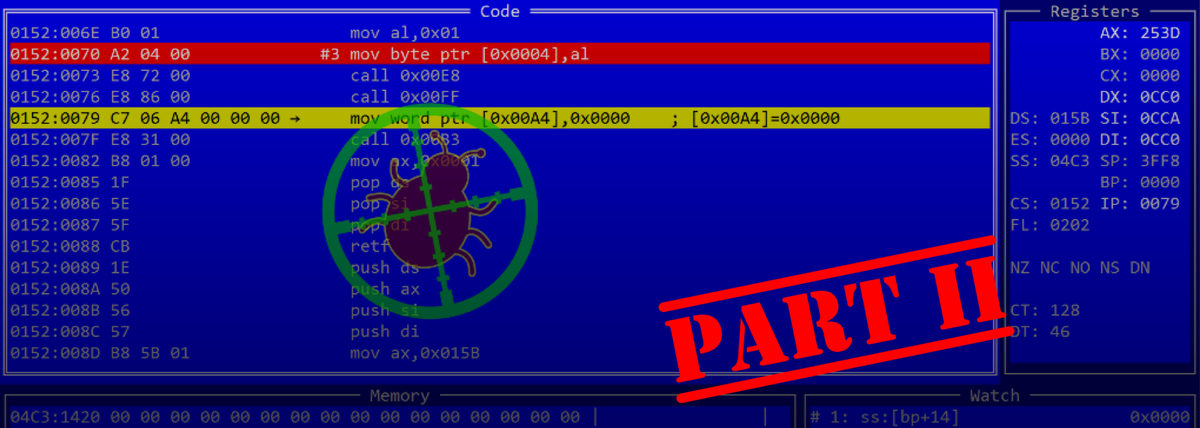
Take a look at the following screen shot:

Notice the register values displayed to the right of the current instruction? This additional information is referred to as “assembly annotations”.
These annotations are determined by parsing the operands of disassembled instructions using the expression engine. Further, the disassembler was updated to provide additional information about “implicit registers”.
For example, when looking at a call instruction, the sp and bp registers are handy to know so the disassembler reports these as implicit registers.
Assembly annotations are a nice convenience when using the debugger but they’re invaluable in execution listing (described below).
Memory Breakpoints
Memory breakpoints are an extremely powerful debugger feature. I don’t know how many times I’ve used a memory break point to figure out where a bug originates or even just to understand how something is working. They’re particularly invaluable when there’s no source code available — the typical case in trying to get Win3mu working.
Win3mu supports three kinds of memory break points:
- Memory Change — breaks when the value at a memory address changes
- Memory Write — breaks when memory is written to, even if the value doesn’t change
- Memory Read — breaks when a memory address is read from.
The memory change breakpoints are implemented using the same IMemoryBusDebug interface. You may have noticed it has one additional method that I didn’t mention before: DidMemoryChange .
DidMemoryChange performs similar checks for changed memory addresses as GetMemoryState but since this method is called on every instruction it is optimized to simply check if anything changed (as opposed to returning what changed).
The memory read and write breakpoints are implemented by replacing the current MemoryBus on the CPU with a debugger implementation that watches for specific memory operations before forwarding to the original memory bus. If the CPU reads or writes to an address for which there’s a breakpoint a flag is set on the break point which causes it to trip on the next instruction.
The memory read and write break points suffer the same limitations as described above for memory change detection — ie: they won’t detect memory operations outside the CPU (ie: by the emulator) or through different selectors for the same memory.
Breakpoint Match and Break Conditions
Breakpoints support two conditions that determine when the break point actually triggers the debugger. Both are implemented as optional expressions that are attached to the base Breakpoint class.
The first is the Match condition. The match condition is an additional expression to check if the break point should trip.
For example, Win3mu supports a “wndproc” breakpoint that breaks each time the emulator calls a window procedure in the 16-bit code. The breakpoint can be refined by adding a match condition.
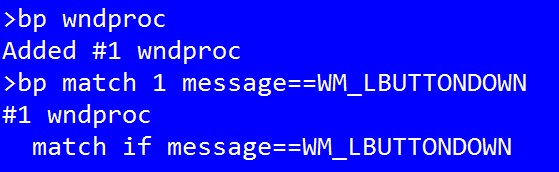
I mentioned above that the expression engine supports symbol scopes. These scopes are used to provide additional symbols that are only available in the context of the breakpoint in question. WndProc breakpoints have properties for hWnd, message, wParam and lParam for use in these conditional expressions.
Once a breakpoint is triggered and the match expression matched (if present), it’s considered tripped and its TripCount property is incremented. Before actually breaking however one final condition is checked — the “break” condition:
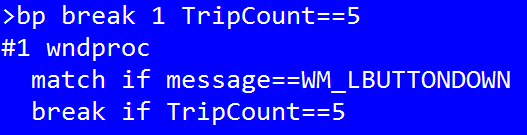
This breakpoint would break after 5 left mouse button presses.
Global Symbols
The other use case for symbol scopes is for custom global symbols. You’ll notice in the above example the symbol WM_LBUTTONDOWN .
Win3mu registers a custom symbol scope that includes all the standard Window messages as well as the 16-bit addresses for all Windows API functions provided by the emulator. This makes it easy to set a breakpoint on an API method:
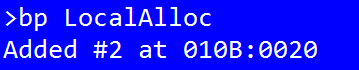
You could even set a condition expression to only break on certain parameters. eg: to break on allocations above 1k:
bp LocalAlloc
bp match 1 word ptr ss:[sp+6] >= 1024(dword ss:[sp] = return address, word ss:[sp+4] = flags, word ss:[sp+6] = size of allocation)
Extending the Debugger
One of the important requirements for the debugger was the ability to extend it to suit the program hosting the CPU. In Win3mu the debugger is built in three layers:
- DebuggerCore — the core debugging facilities including the command dispatcher, expression engine, break point management etc…
- TextGuiDebugger — the text GUI view and a few additional commands for navigating the code and memory window views.
- Win3muDebugger — adds commands for dumping the global heap, open file handles, module information, wndproc break points, symbols for API methods and window message names.
The debugger supports extensibility through the following mechanisms:
- Custom command handlers for the command dispatcher
- Custom break point kinds
- Custom symbol scopes
Real World Use
Since finishing the debugger I’ve been using it quite heavily to diagnose why certain programs don’t run under Win3mu. It works remarkable well — particularly the memory break points.
I’ve also found the execution logs to be extremely useful. Execution logs run independently of the debugger but use the same disassembler and assembly annotation features to write every executed instruction to a log file.
Execution logs slow down the emulator quite a bit but the ability to trace and search backwards through the execution history provides an extremely powerful mechanism for understanding what led up to a problem.